Efficacy & Safety

In a clinical study, 100% of patients taking VILTEPSO showed an increase in dystrophin levels

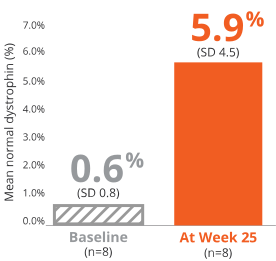
Average dystrophin level increase was nearly 6% at week 25 of treatment.

Impact on Dystrophin Levels

VILTEPSO significantly increased dystrophin production
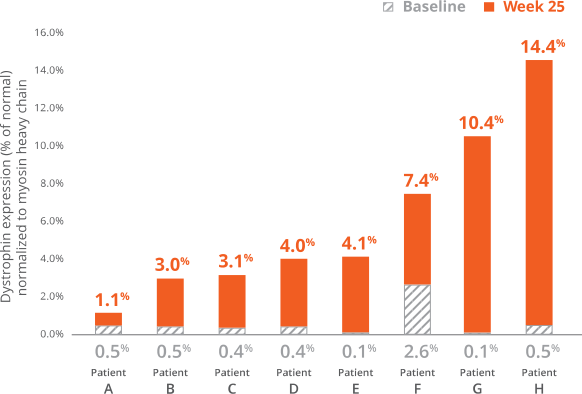
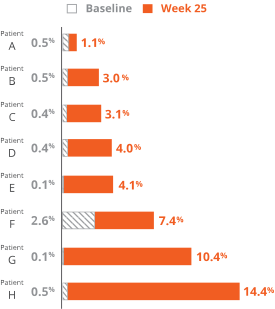
Bar chart showing dystrophin levels increased for 7 of 8 patients after 25 weeks of VILTEPSO treatment Bar chart showing dystrophin levels increased for 7 of 8 patients after 25 weeks of VILTEPSO treatment

88% (7 out of 8 people) showed increases of ~3% or higher, measured at week 25 of treatment.

These significant increases in dystrophin production with VILTEPSO were identified by a method called western blot and verified by a highly sensitive measuring technique known as mass spectrometry.

VILTEPSO increased dystrophin levels to
nearly 6% of normal
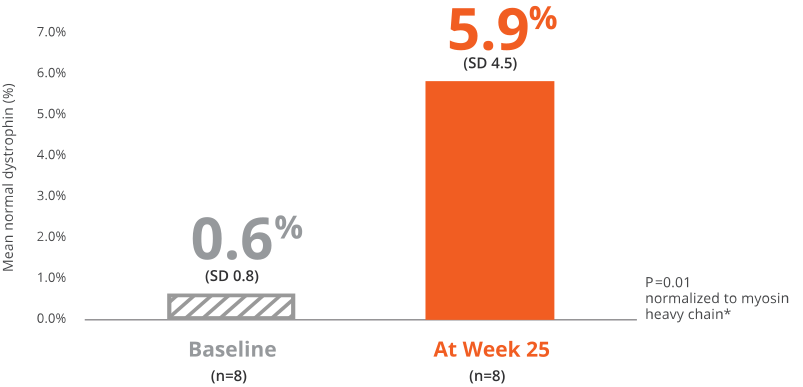
Bar chart showing dystrophin levels as a percentage of normal at baseline and Week 25 for each patient treated with VILTEPSO Bar chart showing dystrophin levels as a percentage of normal at baseline and Week 25 for each patient treated with VILTEPSO

VILTEPSO was studied in 16 ambulatory (walking) boys ages 4 to less than 10 years who were receiving a stable dose of corticosteroids for at least 3 months.

In this graph, their average dystrophin levels at week 25 of VILTEPSO treatment are compared with their average dystrophin levels before treatment.

Secondary Endpoints

In the same clinical study, additional results
included evidence of dystrophin production and
timed motor function tests

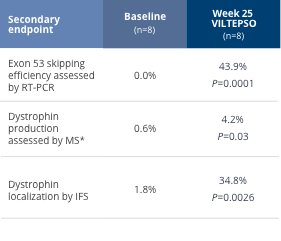
Dystrophin Production Evidence
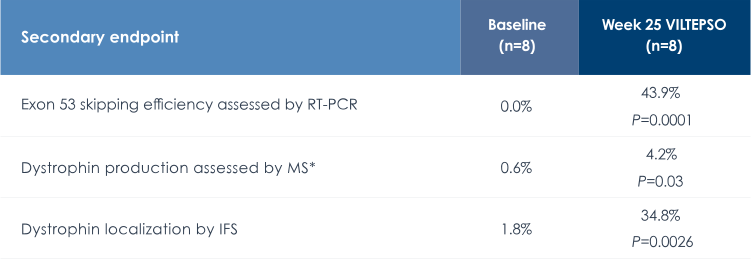
Table showing dystrophin levels at baseline and Week 25 for patients A through H; all 8 patients showed increased expression Table showing dystrophin levels at baseline and Week 25 for patients A through H; all 8 patients showed increased expression
*Exon 53 skipping efficiency assessed by RT-PCR. Mean dystrophin levels assessed by mass spectrometry. Dystrophin localization assessed by immunofluorescence staining. RT-PCR=reverse transcriptase-polymerase chain reaction.
 

Motor Function Tests

Functional tests were compared to Duchenne natural history (DNHS) data as the control group rather than to placebo. Definitive conclusions should not be drawn. Functional data are not in the US Prescribing Information.
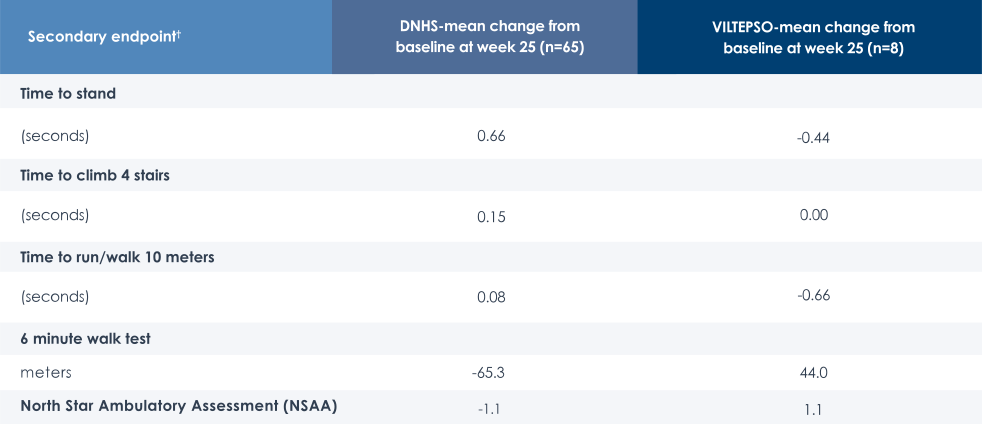
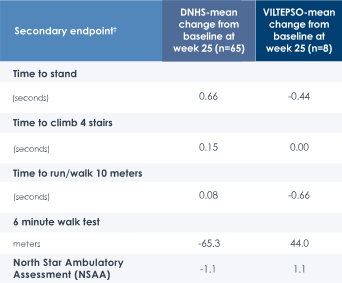
Table comparing motor function over time between VILTEPSO-treated patients and a natural history control group Table comparing motor function over time between VILTEPSO-treated patients and a natural history control group
Control subjects were matched for age and corticosteroids. Negative time means less time; positive time means more time. Negative distance means less distance traveled; positive distance means greater distance traveled. Negative NSAA means lower score compared to baseline; positive NSAA means higher score compared to baseline.

Safety

Safety profile evaluated in two 24-week clinical studies

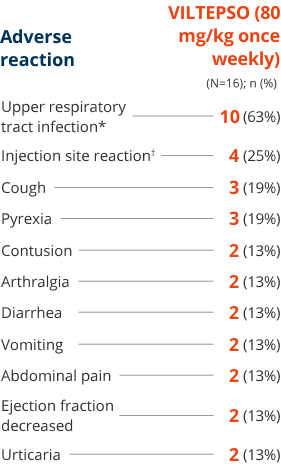
Adverse reactions reported in ≥10% of people with DMD treated with VILTEPSO 80 mg/kg once weekly
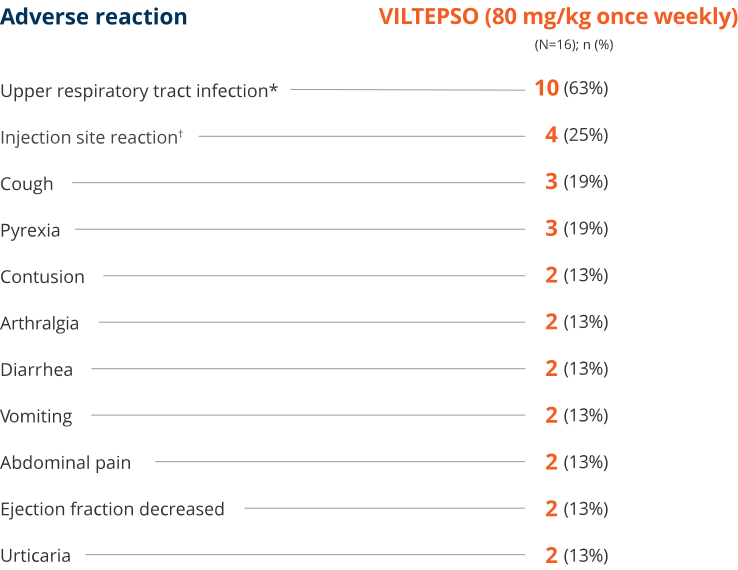
Table showing adverse reactions reported in 10% or more of patients treated with VILTEPSO 80 mg/kg weekly Table showing adverse reactions reported in 10% or more of patients treated with VILTEPSO 80 mg/kg weekly
*Upper respiratory tract infection includes the following terms: upper respiratory tract infection, nasopharyngitis, and rhinorrhea.
Injection site reaction includes the following terms: injection site bruising, injection site erythema, injection site reaction, and injection site swelling.

No patients in the clinical trial discontinued treatment as a result of treatment-related Serious Adverse Events (SAEs)

MUSCLE FUNCTION DATA

An extended view of patients on VILTEPSO
over 4 years

Functional tests were compared to Duchenne natural history data as the control group rather than to placebo.
Definitive conclusions should not be drawn. Functional data are not in the US Prescribing Information.

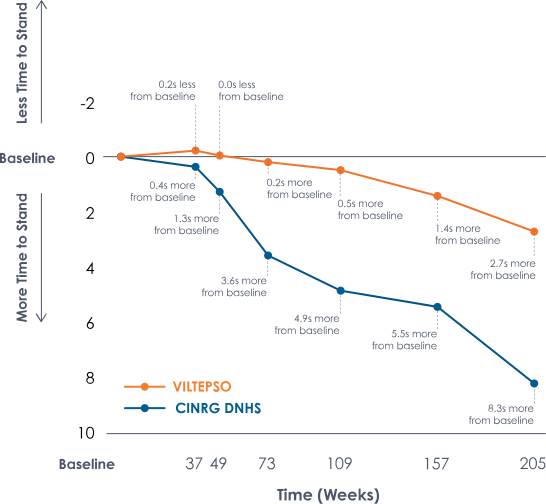
Time to stand over 4 years*

With VILTEPSO, the mean change from baseline at week 205 was 2.7 seconds and in the CINRG group the mean change from baseline at week 205 was 8.3 seconds.

Time to stand measures the amount of time it takes for a DMD patient to go from lying on their back to standing.

Seconds


Line graph comparing mean change from baseline in time to stand between VILTEPSO-treated patients and natural history control group over 4 years Line graph comparing mean change from baseline in time to stand between VILTEPSO-treated patients and natural history control group over 4 years
 

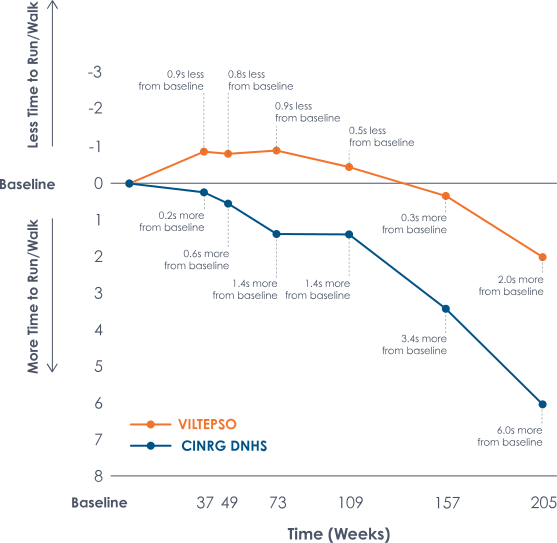
Time to run/walk 10 meters over 4 years*

With VILTEPSO, the mean change from baseline at week 205 was 2.0 seconds and in the CINRG group the mean change from baseline at week 205 was 6.0 seconds.

Time to run/walk 10 meters measures the amount of time it takes for a DMD patient to run or walk 10 meters.

Seconds


Line graph comparing mean change from baseline in time to run 10 meters between VILTEPSO-treated patients and natural history control group over 4 years Line graph comparing mean change from baseline in time to run 10 meters between VILTEPSO-treated patients and natural history control group over 4 years
 

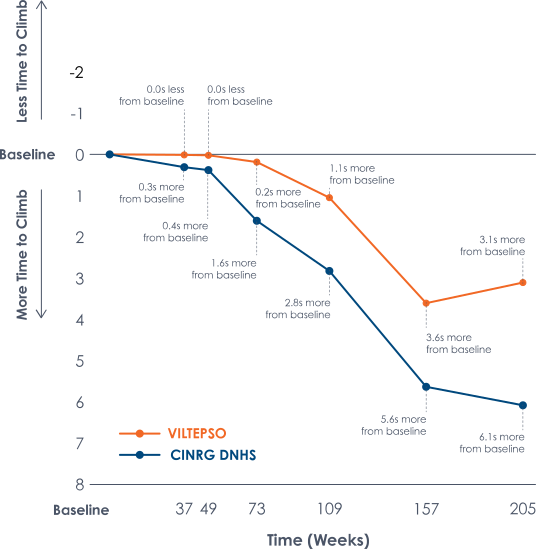
Time to climb four stairs over 4 years*

With VILTEPSO, the mean change from baseline at week 205 was 3.1 seconds and in the CINRG group the mean change from baseline at week 205 was 6.1 seconds.

Time to climb four stairs measures the amount of time it takes for a DMD patient to climb four stairs.

Seconds


Line graph comparing mean change from baseline in time to climb 4 stairs between VILTEPSO-treated patients and natural history control group over 4 years Line graph comparing mean change from baseline in time to climb 4 stairs between VILTEPSO-treated patients and natural history control group over 4 years
*The control subjects for this trial were matched for age, ambulatory status, corticosteroid use, and geographic location from the CINRG DNHS registry.

Negative time means less time; positive time means more time.
CINRG=Cooperative International Neuromuscular Research Group; DNHS=Duchenne Natural History Study.

FOUR-YEAR SAFETY DATA

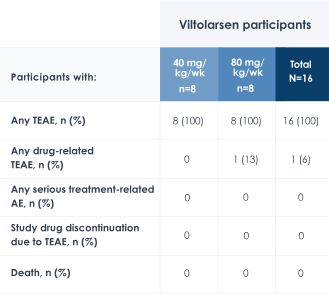
Safety assessment for open-label,
four-year extension study data
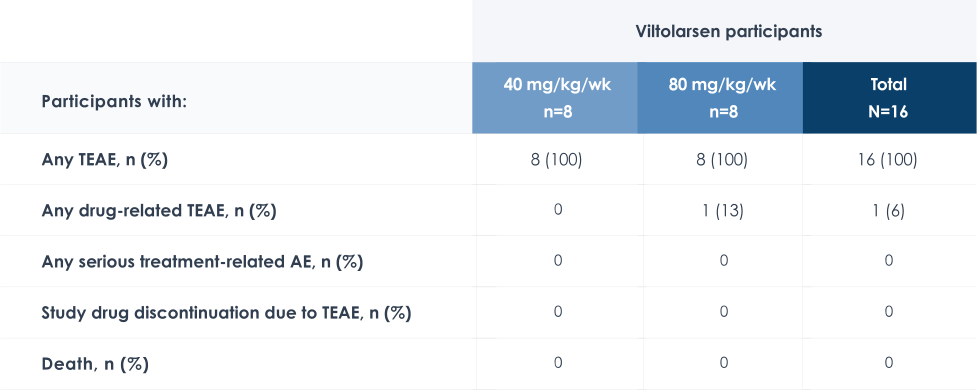
Table summarizing treatment-emergent adverse events and serious adverse events in patients treated with VILTEPSOTable summarizing treatment-emergent adverse events and serious adverse events in patients treated with VILTEPSO

AE=adverse event; TEAE=treatment-emergent AE; wk=week.

No patients discontinued the study as a result of
treatment-related Serious Adverse Events (SAEs)


Young child playing in a sandbox with a toy truck on a foggy day near a wooden fence. Portrait of a young child with curly blond hair wearing a blue shirt, outdoors with trees in the background. Boy smiling while playing a black electric guitar Boy in a wheelchair wearing an orange hoodie, smiling in a bright living room Smiling child holding a blue foam toy airplane outdoors on a sunny day.

Meet the VILTEPSO Ambassadors

Hear and read what real patients and their families have to say about life and treatment with VILTEPSO.

See Patient Stories
Boy smiling while playing a black electric guitar Portrait of a young child with curly blond hair wearing a blue shirt, outdoors with trees in the background. Boy in a wheelchair wearing an orange hoodie, smiling in a bright living room
Important information alert icon

REMEMBER, A DOCTOR IS ALWAYS YOUR BEST RESOURCE FOR information about DMD and determining if VILTEPSO could be the right treatment option for you.

Patient Overview Brochure

Explains the features of VILTEPSO in treating Duchenne, including efficacy and safety

Download Now

Doctor Discussion Guide

Offers helpful questions to ask your doctor when speaking about VILTEPSO

Download Now